
Learning more about
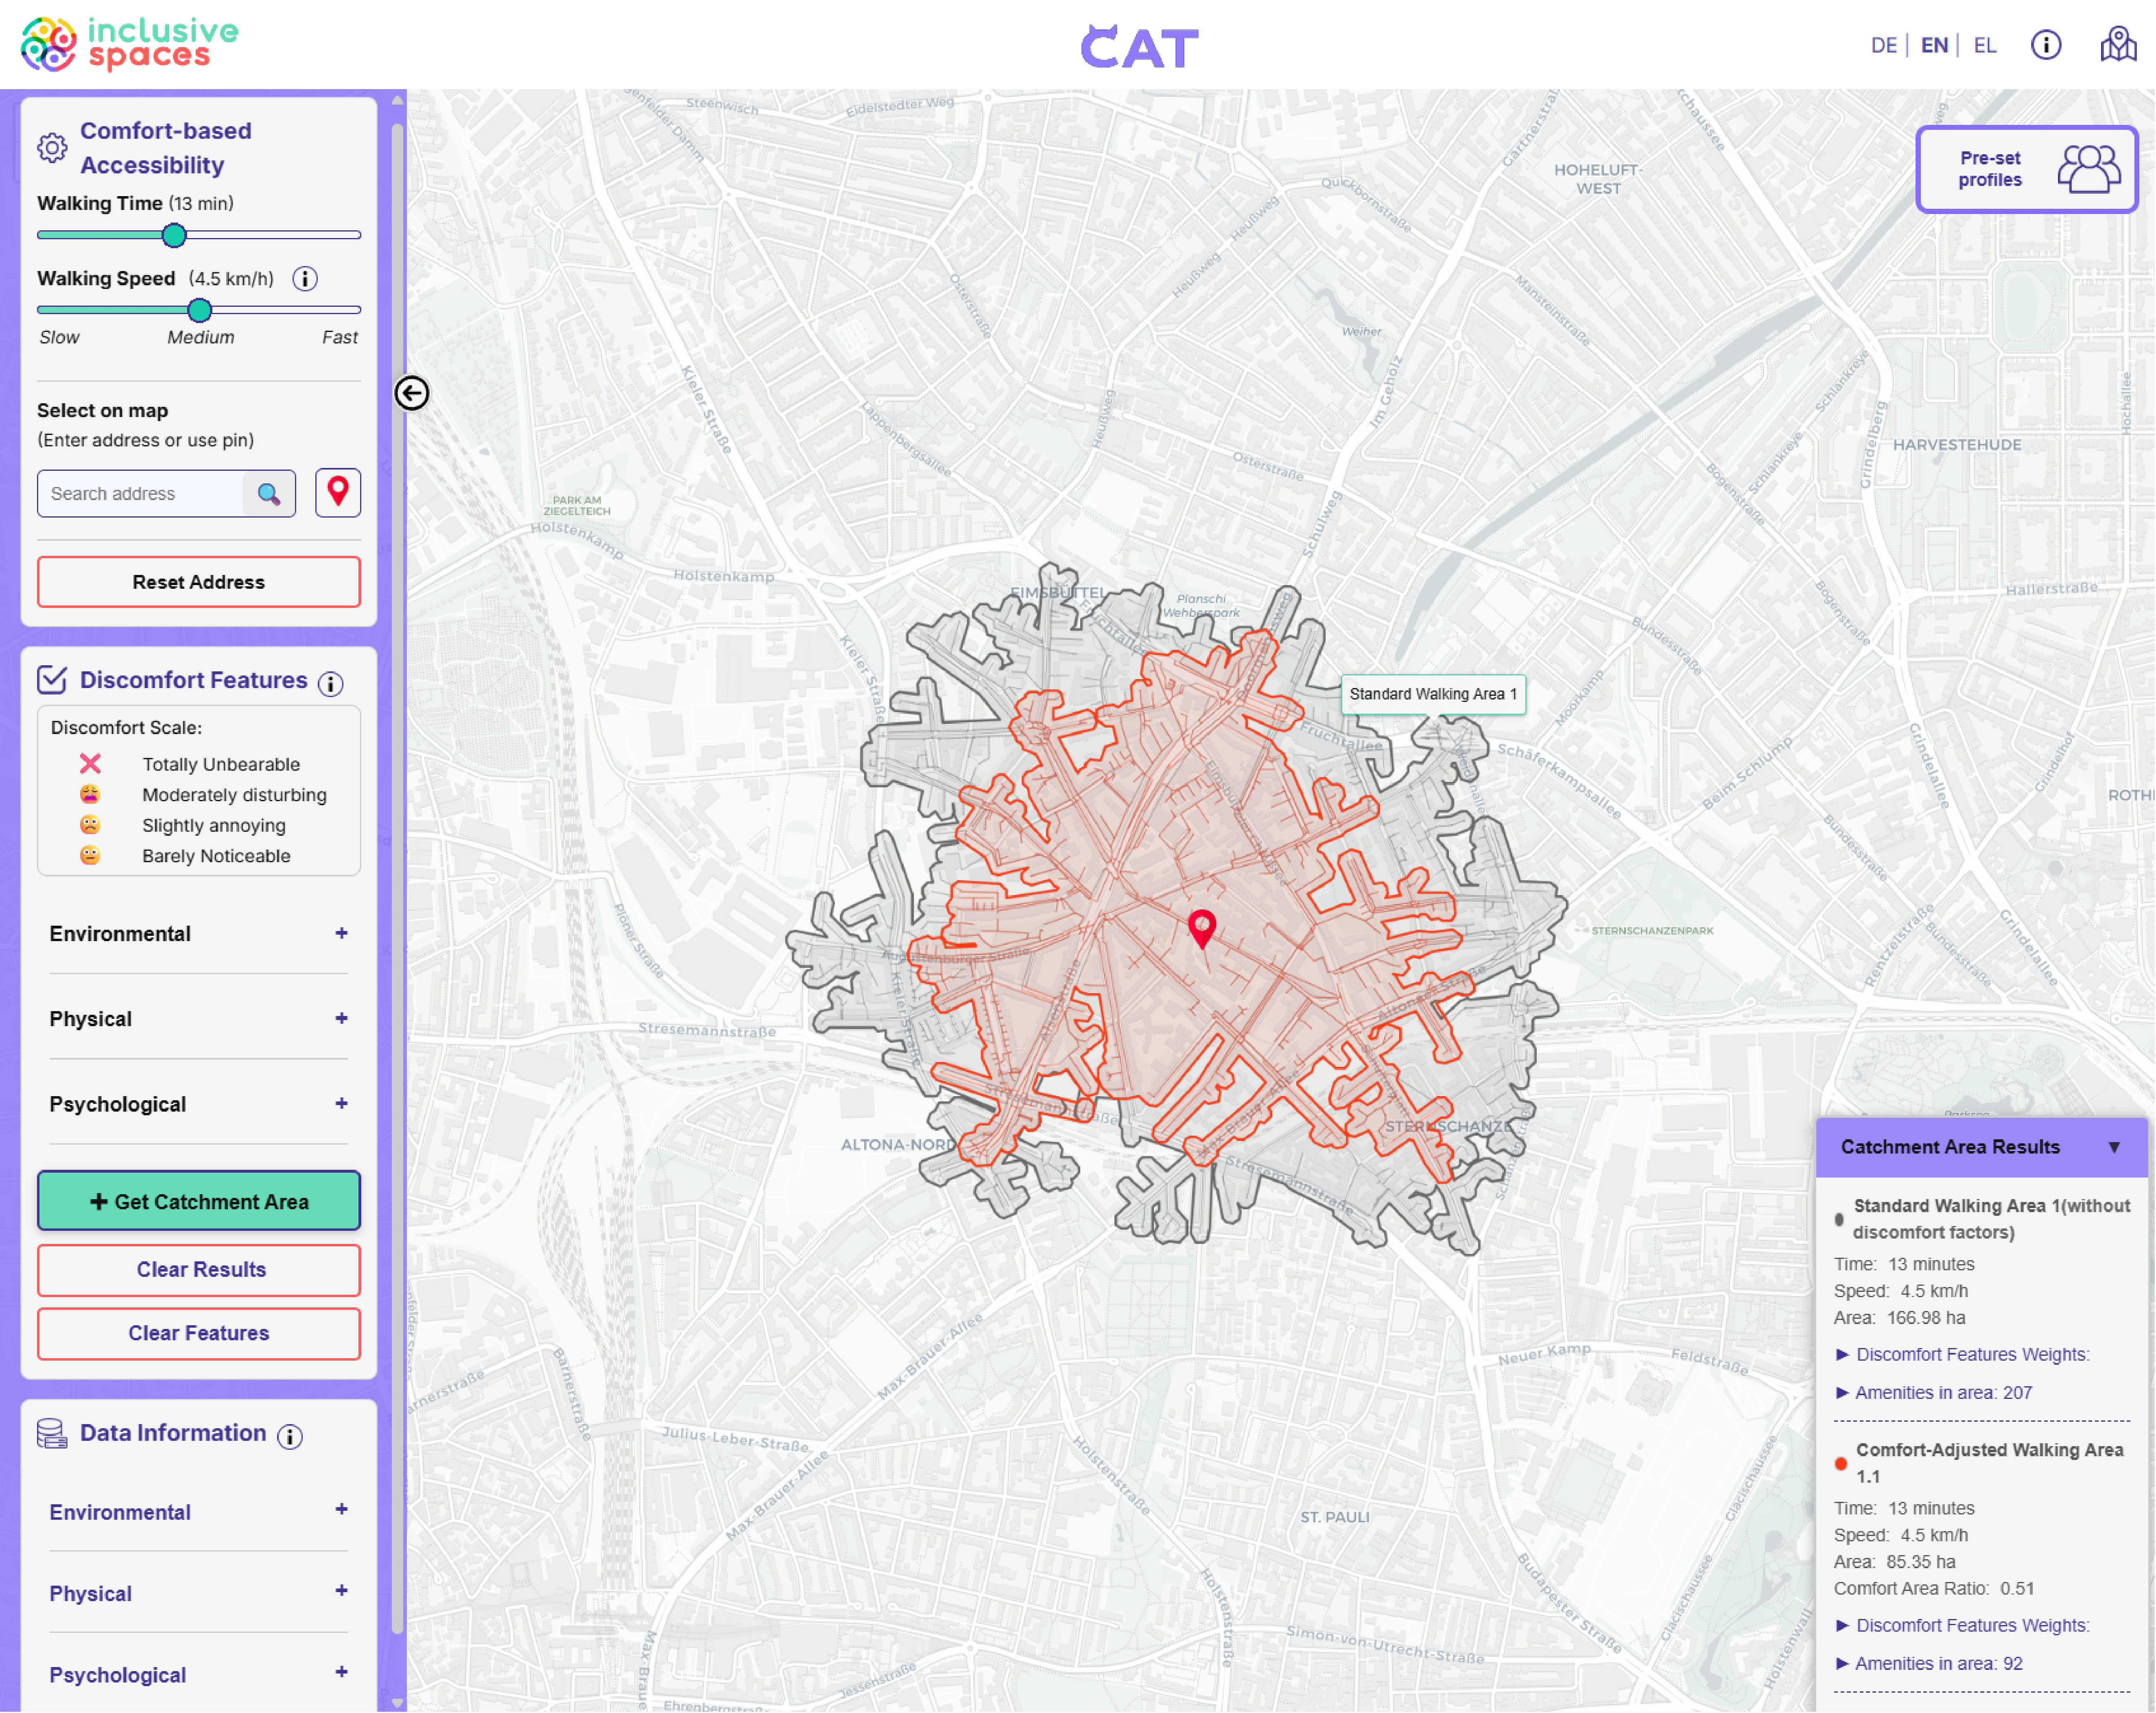
1. What does the CAT interface look like?
2. How to use CAT?
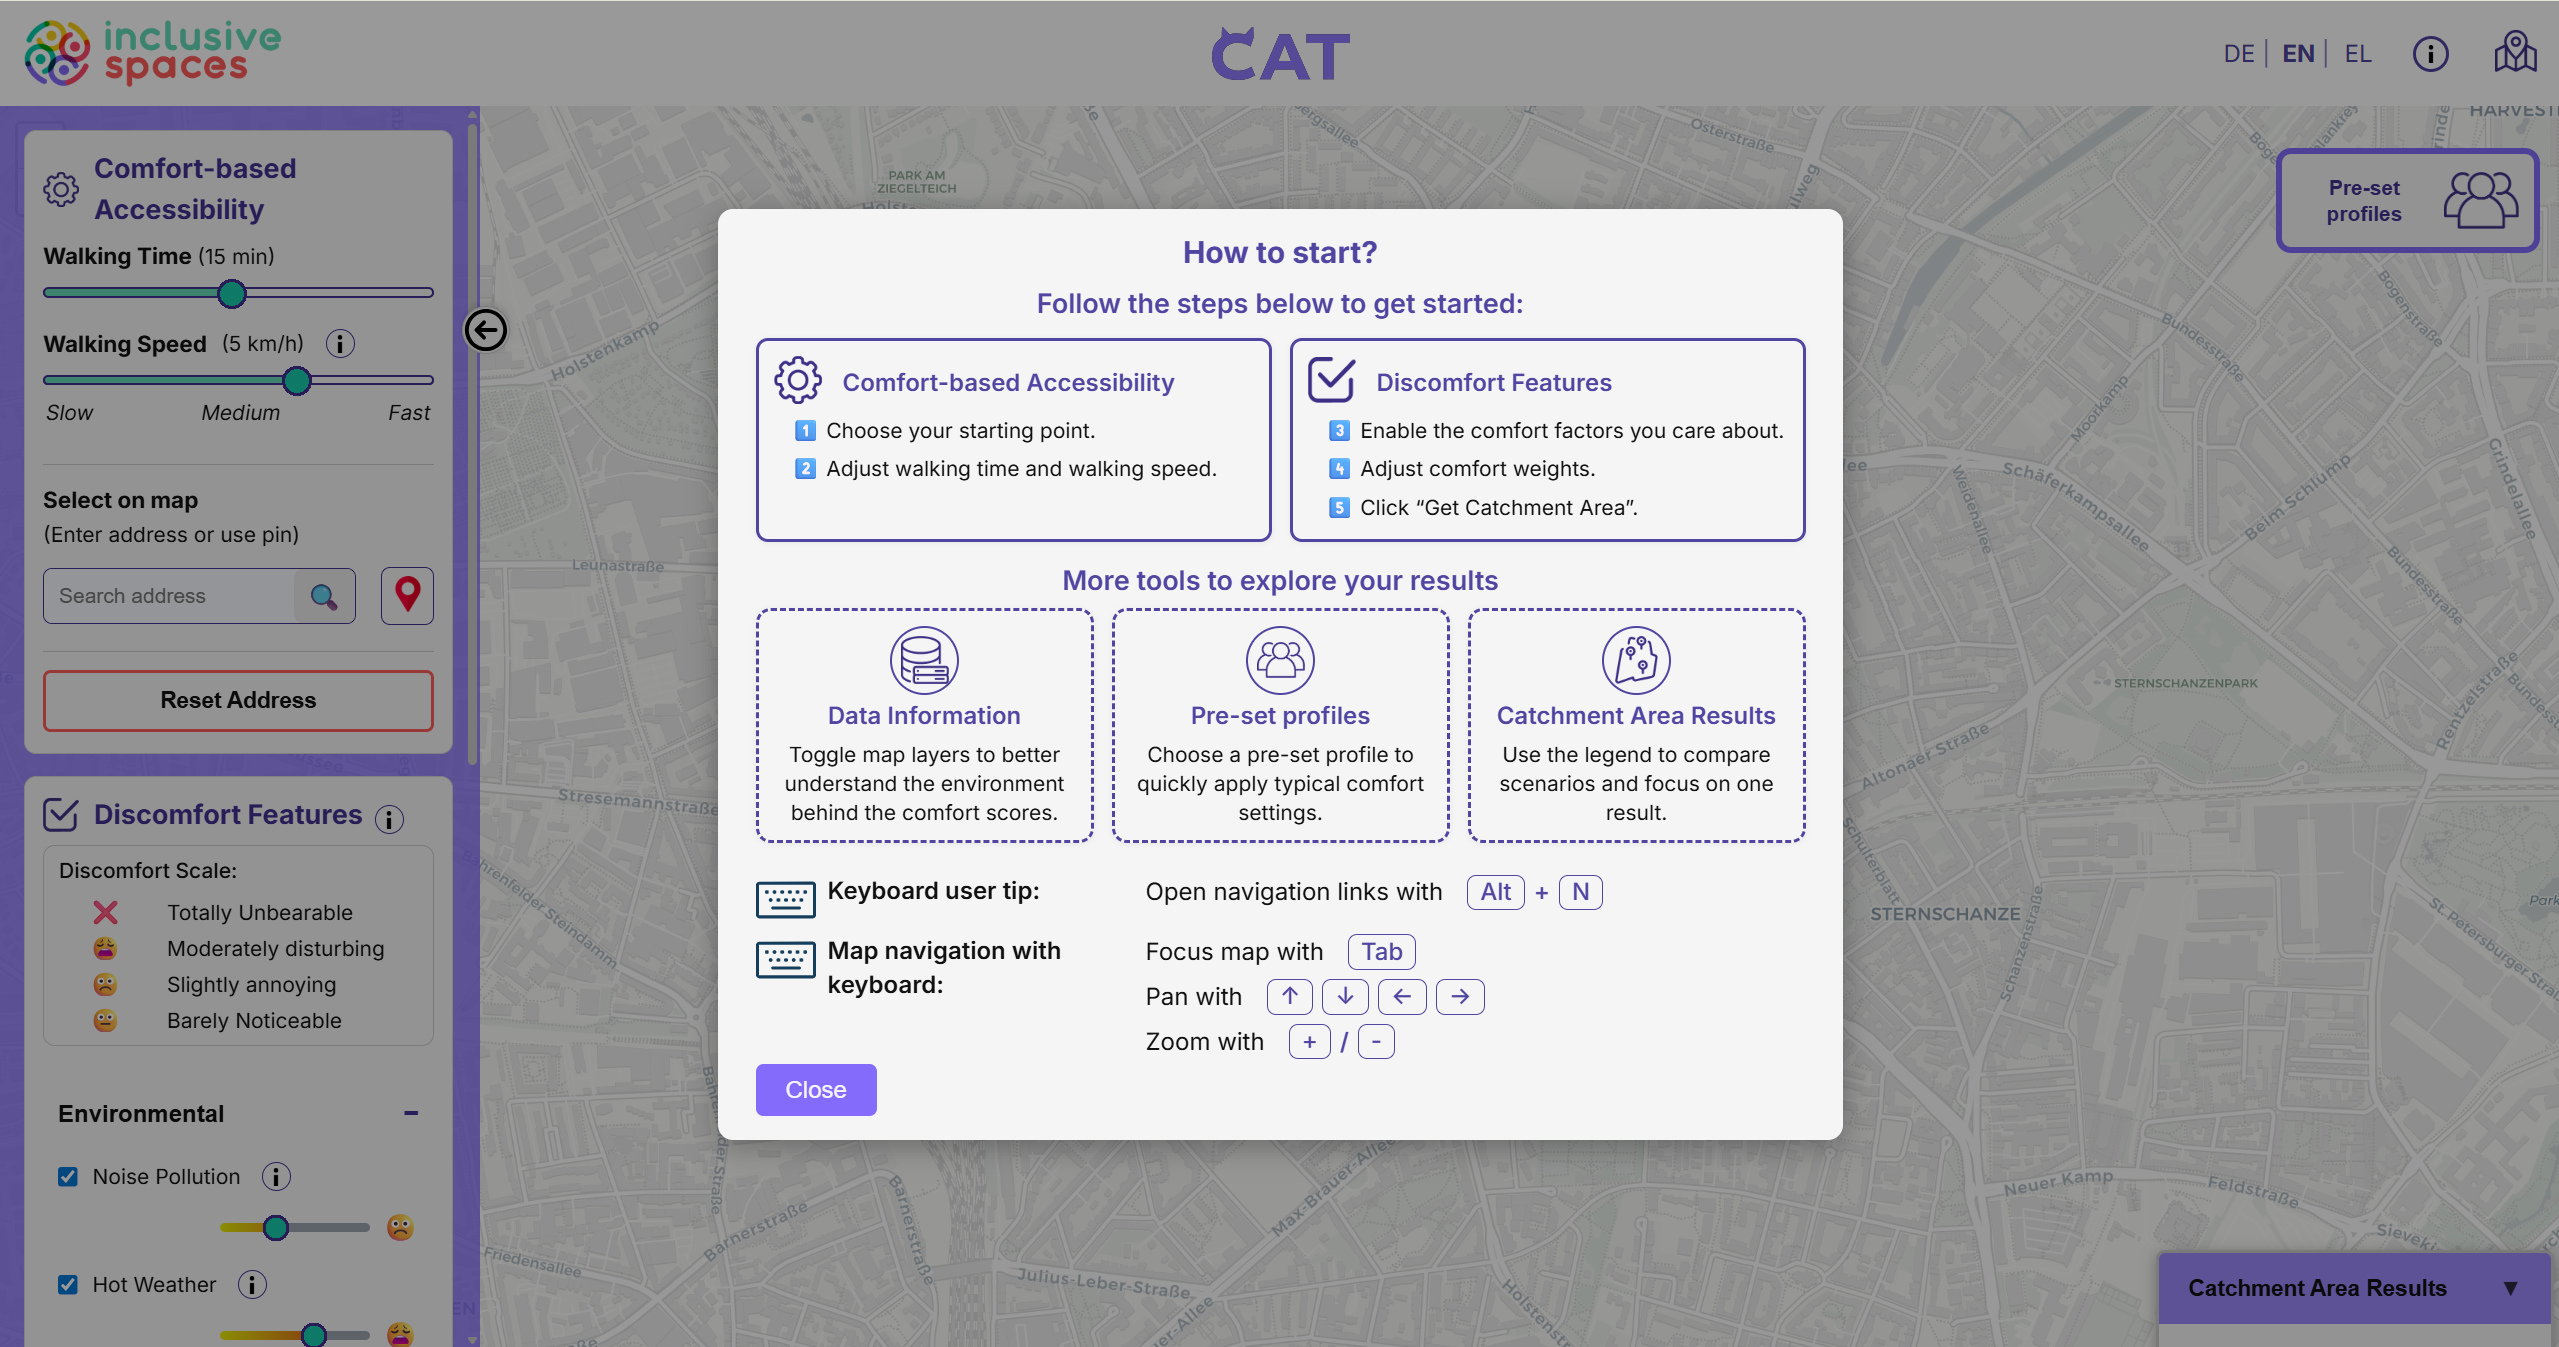
Step 1: Start using CAT
When a city is selected and the map interface is open, a quick start guide introduces the main functions of the tool. It gives users an overview of the workflow and highlights additional tools such as data layers, pre-set profiles, and the result panel.
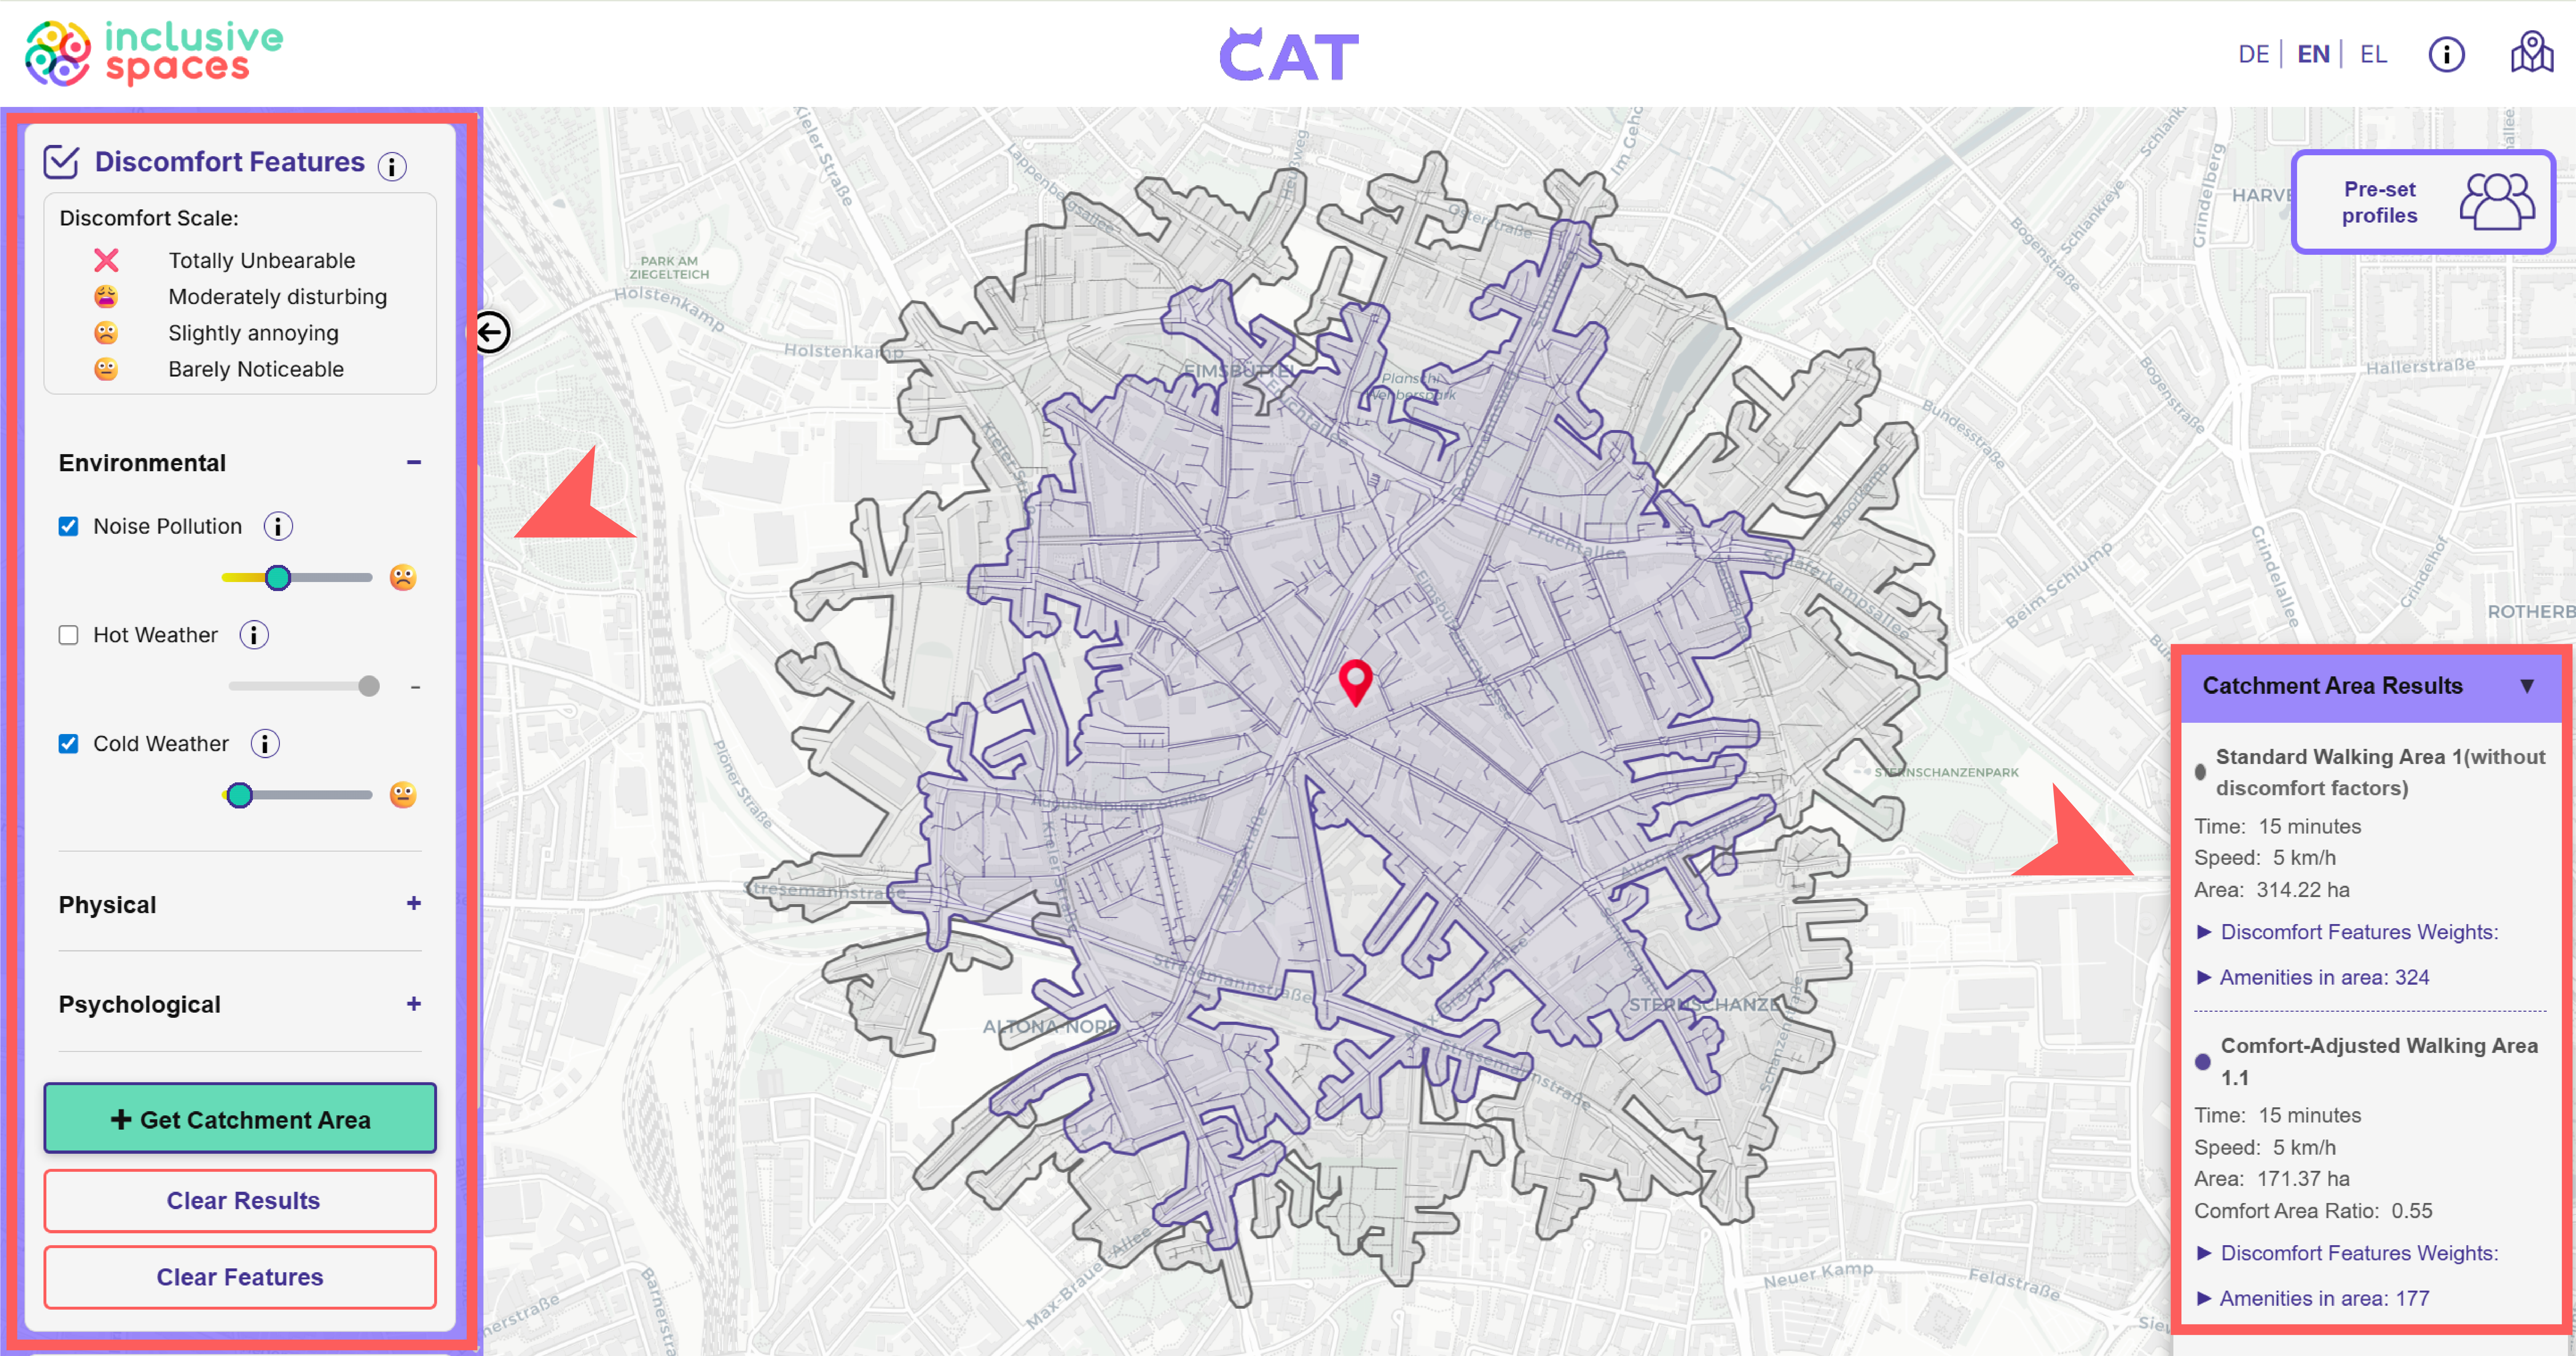
Step 3: Create comfort-based accessibility map
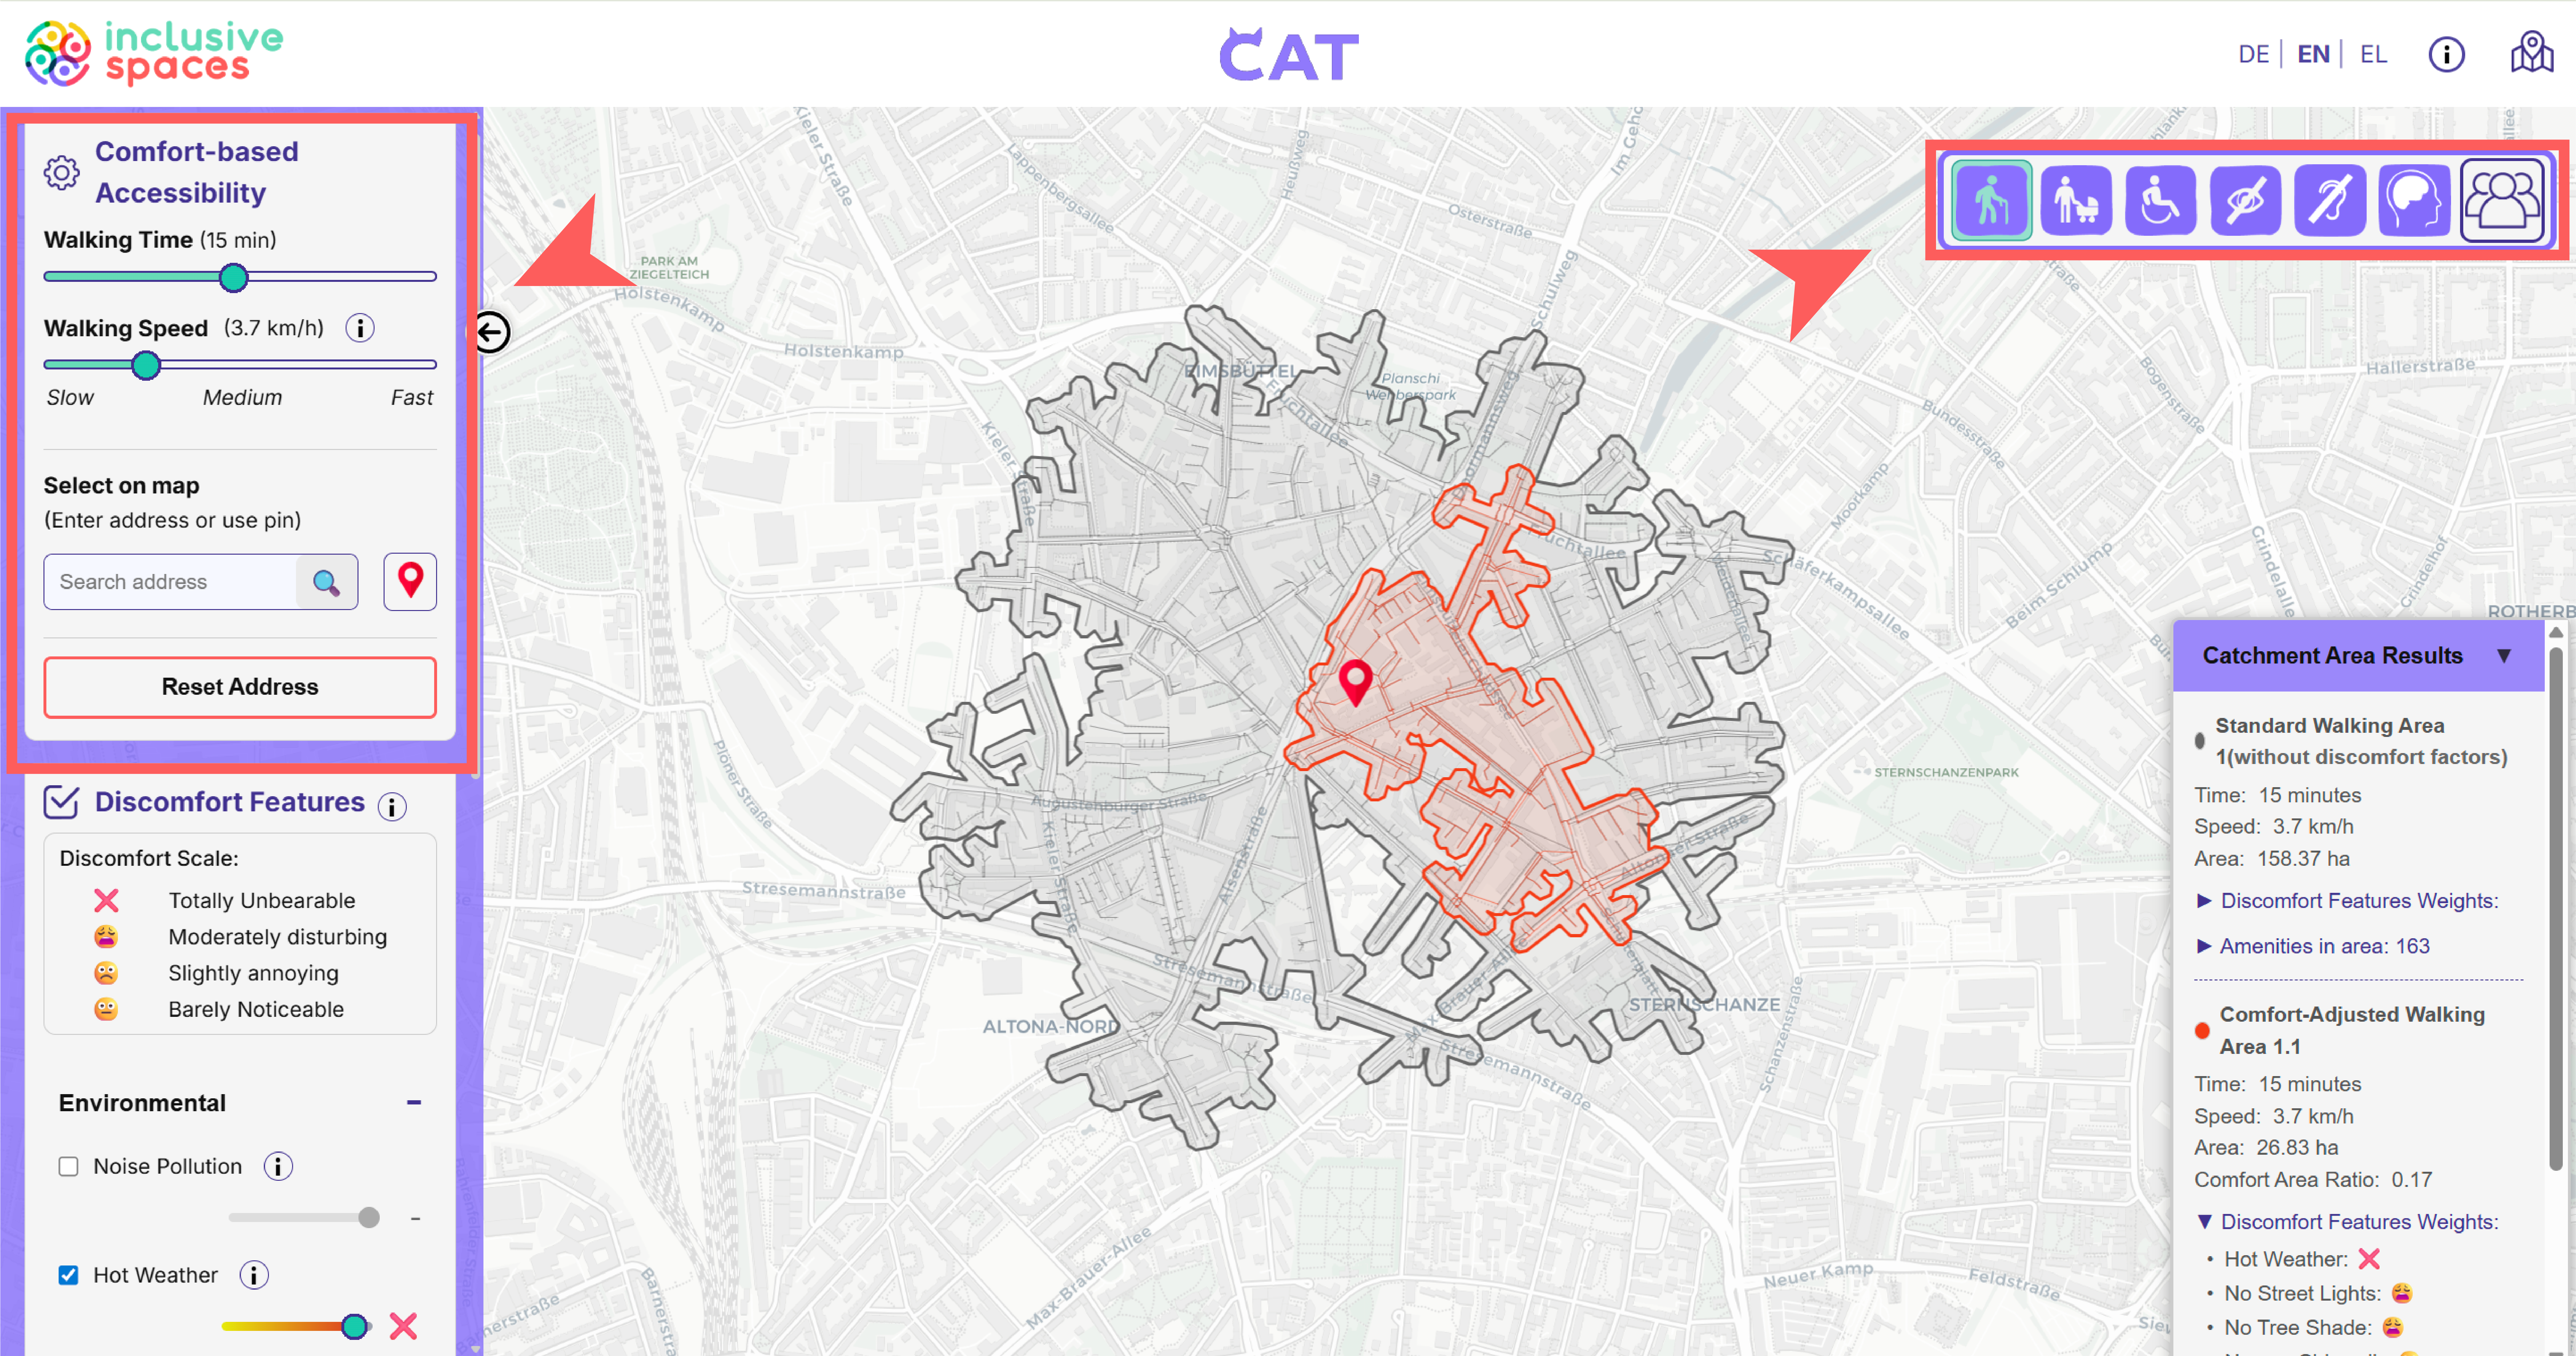
Users can then activate discomfort features and adjust how strongly they should influence the analysis. CAT displays both the standard walking area and the comfort-adjusted walking area, allowing users to compare the results directly.
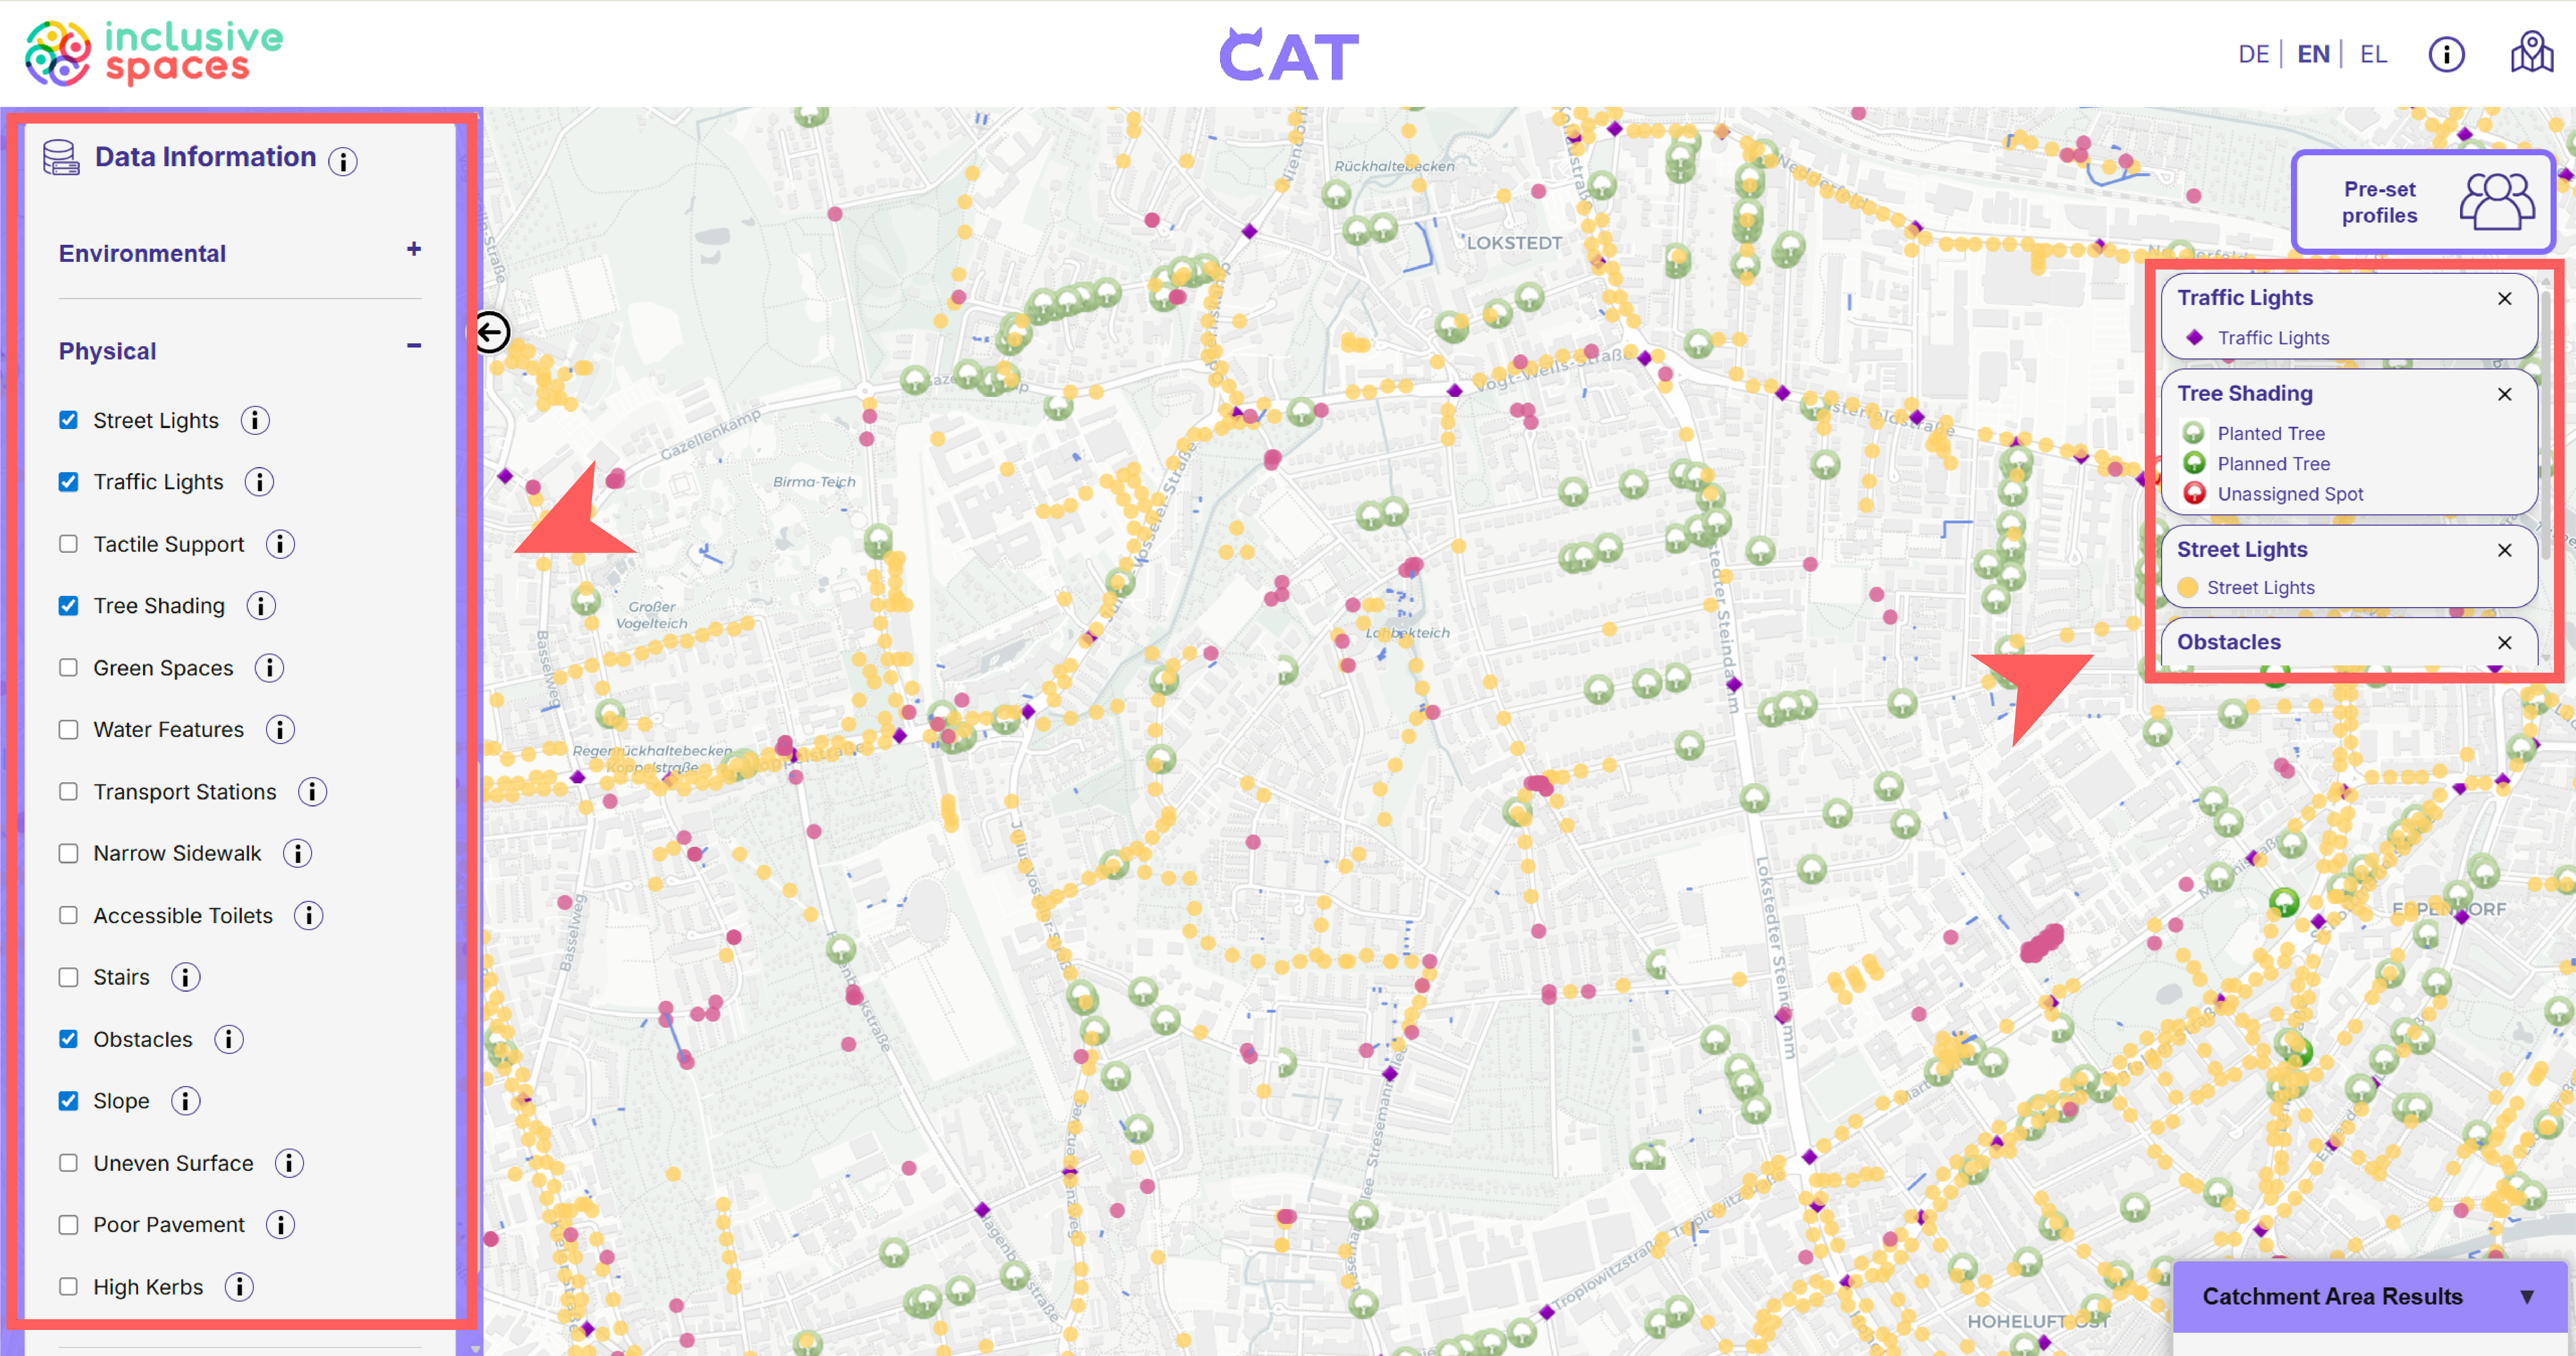
Step 5: Explore map layers (optional)
To better understand the conditions behind the analysis, users can open Data Information and activate additional map layers. These layers provide environmental and accessibility-related information that helps interpret the final result.
Step 2: Create the standard map
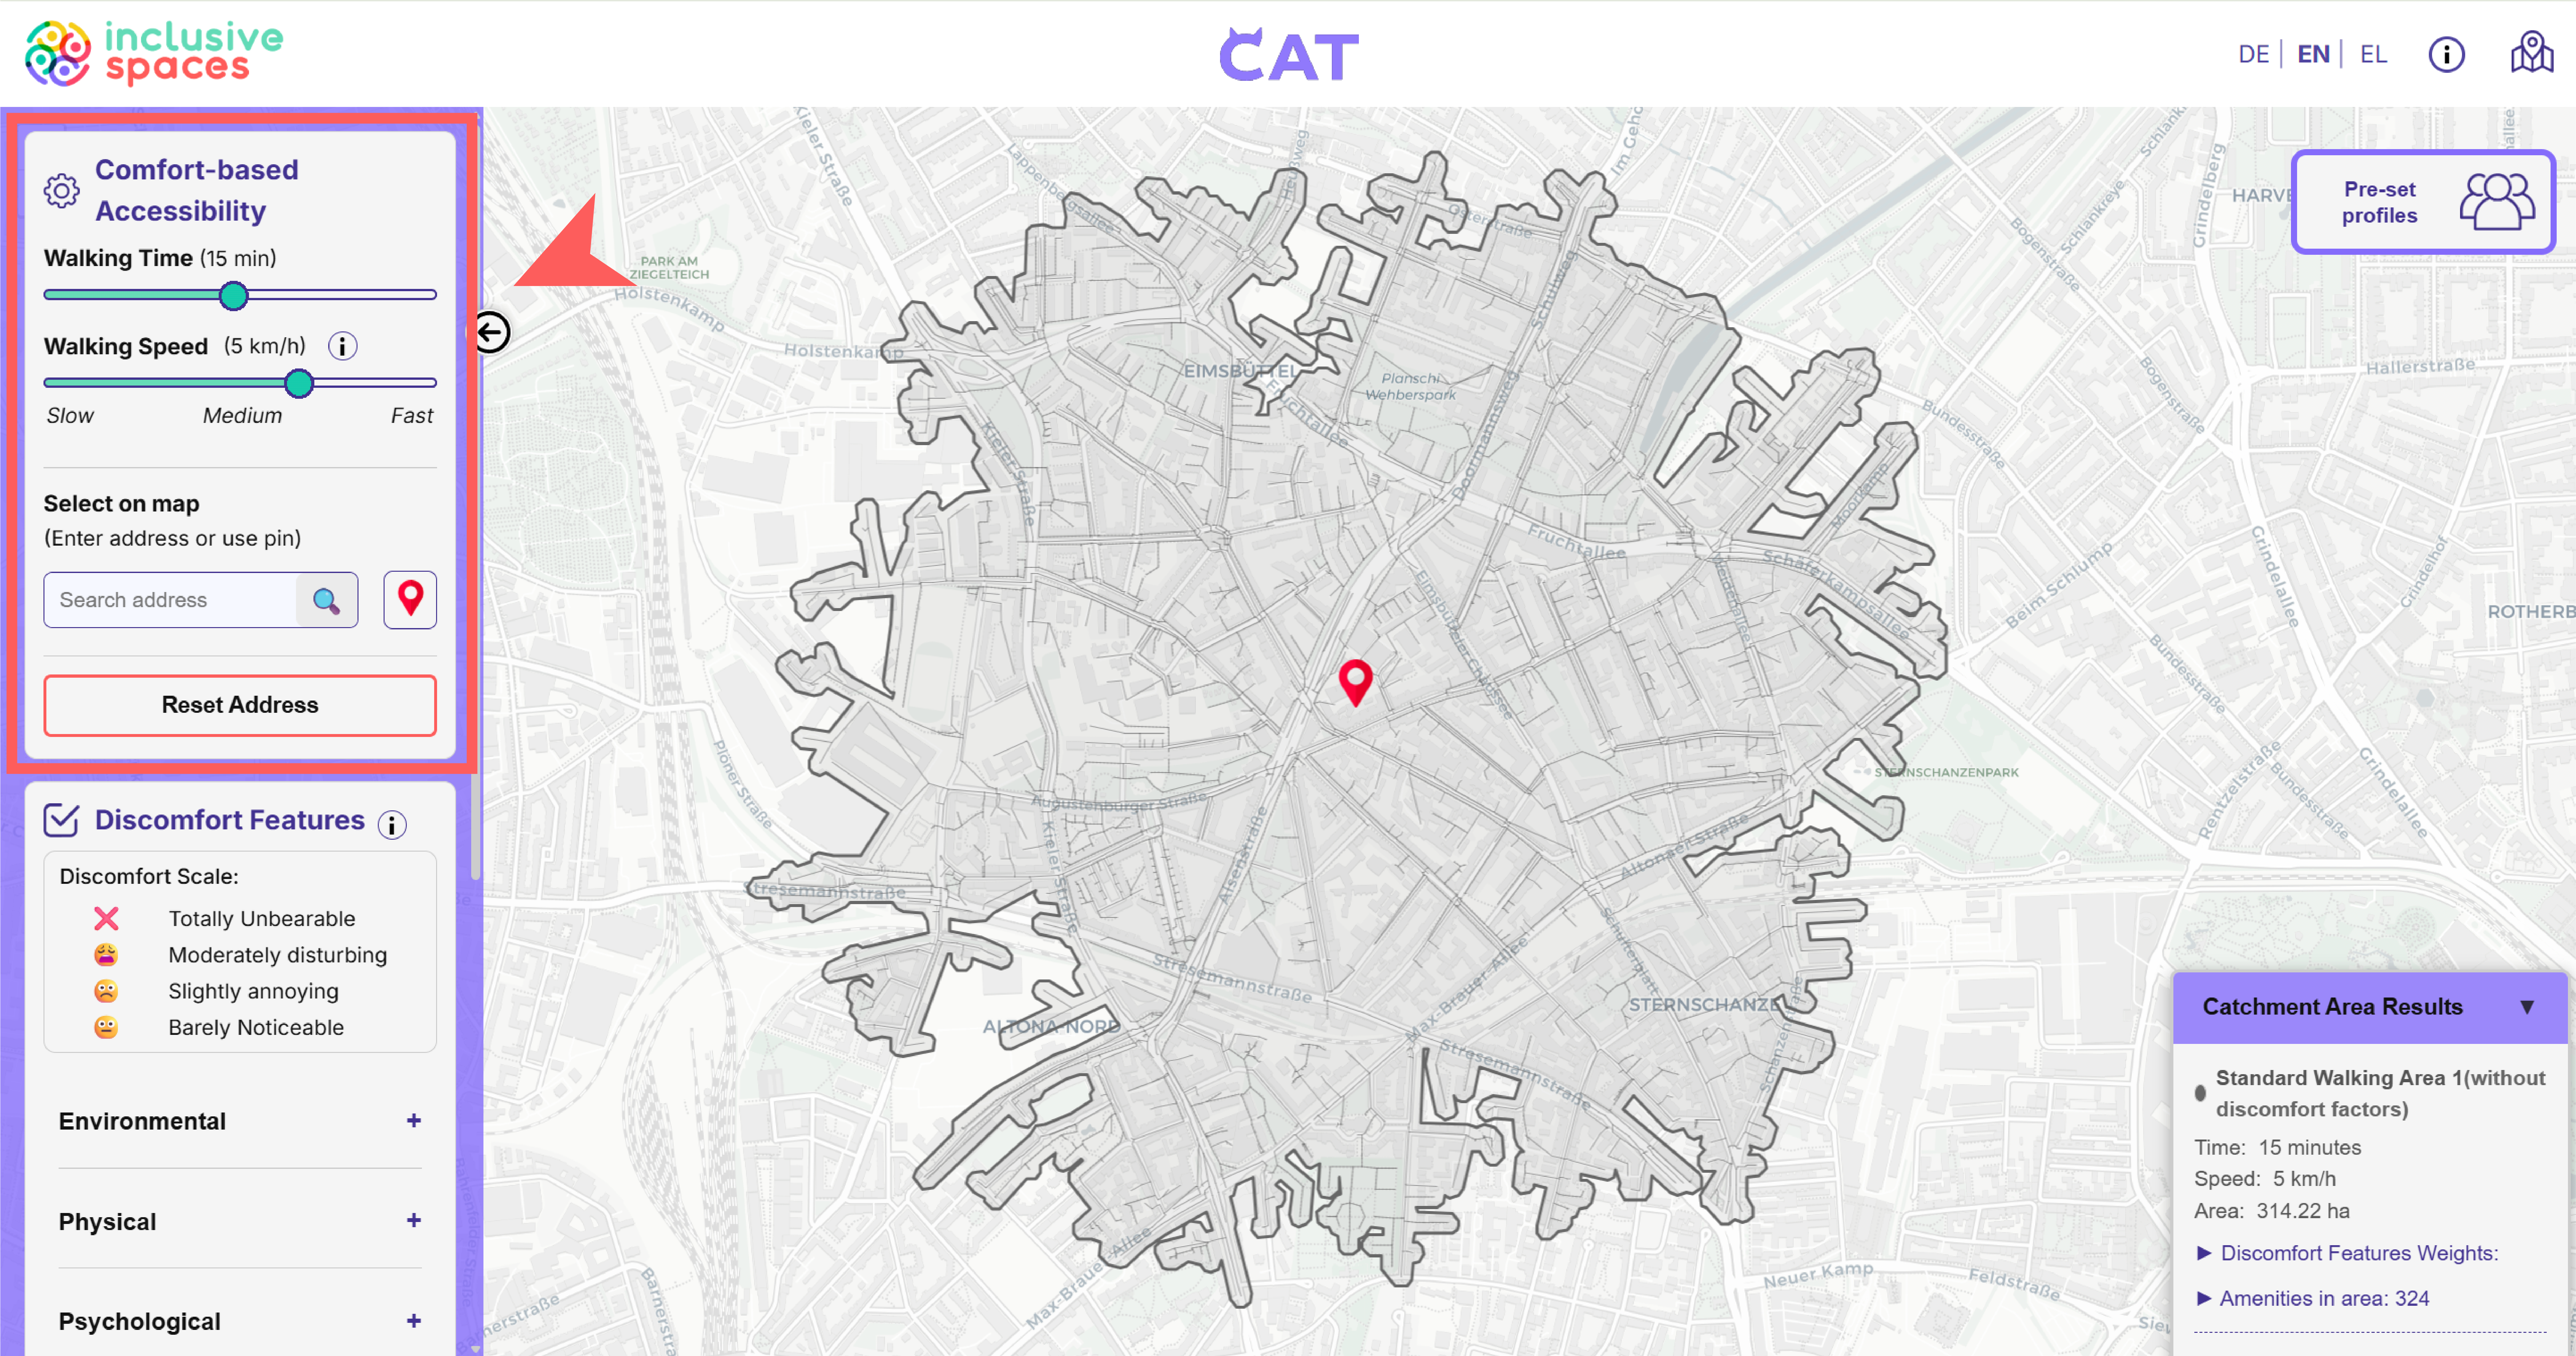
To begin the analysis, users define the main travel settings in the Comfort-based Accessibility panel. This includes selecting the walking time, adjusting walking speed, and setting a starting point either by dragging a marker onto the map or by manually entering an address.
3. Additional features
Step 4: Apply pre-set profiles (optional)
Instead of selecting every factor manually, users can also choose a pre-set profile. These profiles apply predefined settings that reflect different needs and offer a quicker way to generate a comfort-based result.
4. Research basis for the Profiles
Under Construction ...
5. What do you need to set up CAT?
CAT relies on both routing data and city-specific environmental information. In order to generate meaningful accessibility results, it needs a street network for calculating reachable areas, as well as additional datasets that describe local conditions related to comfort and accessibility. These data are prepared and connected in the background so that users can explore them through the CAT interface.
Data
CAT relies on several types of data. A street and path network forms the basis for routing and accessibility analysis, while city boundary data and thematic map layers provide additional local context. These layers may include information such as noise, street lights, trees, tactile support, obstacles, slopes, pavement conditions, or nearby facilities. The routing network is based on OpenStreetMap data, and further city-specific geographic data can be taken from official sources. In Hamburg, for example, such data can be obtained through Geoportal Hamburg. If available, some datasets can also be used as WMS services for visualization in CAT. Datasets needed for the actual accessibility calculation are processed separately in the background.
Data management
Before these datasets can be used in CAT, they need to be processed and linked to the street network. In the background, environmental information is translated into road-based weight values so that different conditions can influence the accessibility result. For example, point, line, or area datasets are matched to nearby street segments, and these segments are then marked according to whether a factor is present or relevant. The processed routing data and related weight fields are managed in Supabase, which supports the database structure used by CAT. For more technical details about the project structure and database workflow, please see the project GitHub repository.

The Comfort-Based Accessibility Tool (CAT) is a tool created within the InclusiveSpaces Project.
InclusiveSpaces is a Horizon Europe project supported by the European Commission under Grant Agreement No. 101147881. The UK participants in this project are co-funded by the UK. Views and opinions expressed are however those of the author(s) only and do not necessarily reflect those of the European Union or European Climate, Infrastructure and Environment Executive Agency (CINEA). Neither the European Union nor the granting authority can be held responsible for them.
Contact: